The grading curve graphically represents the proportion of different grain sizes which the aggregate is composed of and which form part of the shotcrete mix. It provides useful information to find out:
- Whether the distribution of the different aggregate sizes is suitable for pumping
- The fines content of the aggregates (particles with a diameter < 0,125 mm), which affects the properties of workability, internal adhesion and early strength development of the shotcrete mix
Screening test to separate the aggregate particles
The process to obtain the grading curve consists in passing the aggregate sample through a series of standardized sieves of different diameters mounted on a column. The aggregates are exposed to vibration and rotation movements in order to obtain the classification by size. Afterwards, the sieves are removed and the retained material in each one is weighed.
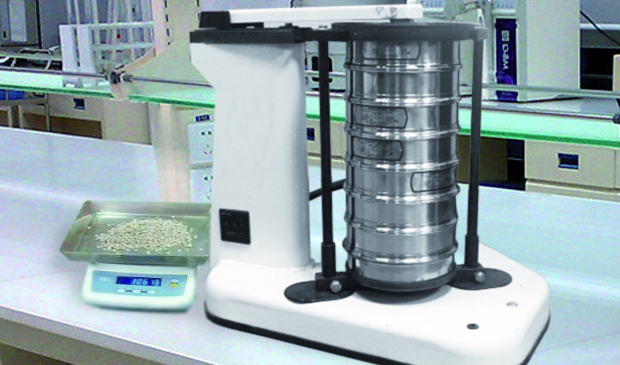
Screening test machine
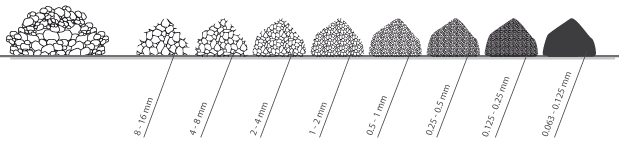
Different sizes of separated particles after the screening
Graphical representation of the screening: Grading curve

The vertical axle of the grading curve represents in % the weight of the particles passing through each sieve and the horizontal axle the sieve opening.
In the example, in the first sieve, with an opening of 16 mm, 100 % of the weight of the aggregate particles passed through, in the second sieve with 8 mm opening, 98,8 %, which means that 1,2 % of the aggregate particles have a size between 8 and 16 mm.
The particles between 4 and 8 mm represent 38,2 % of the total of the aggregate, those between 2 and 4 mm represent 10,6 %, and so on. In this way, the curve with all particle sizes is built up.
Continuous and discontinuous grading curves
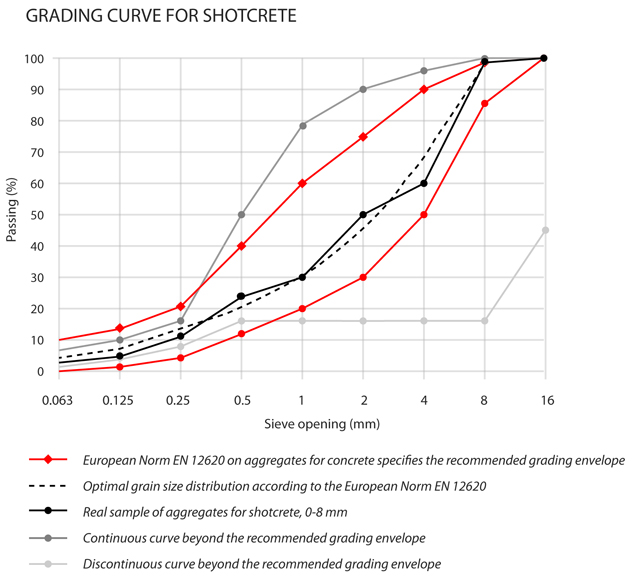
A continuous curve, in contrast to a discontinuous one, represents an aggregate composition with particles of all sizes.
In the graphic, the black curve represents a continuous curve and within the grading envelope recommended by the norm, therefore the aggregate composition is adequate for the shotcrete mixture.
The light grey curve represents the most unfavorable scenario: discontinuous and beyond what is recommended by the norm.
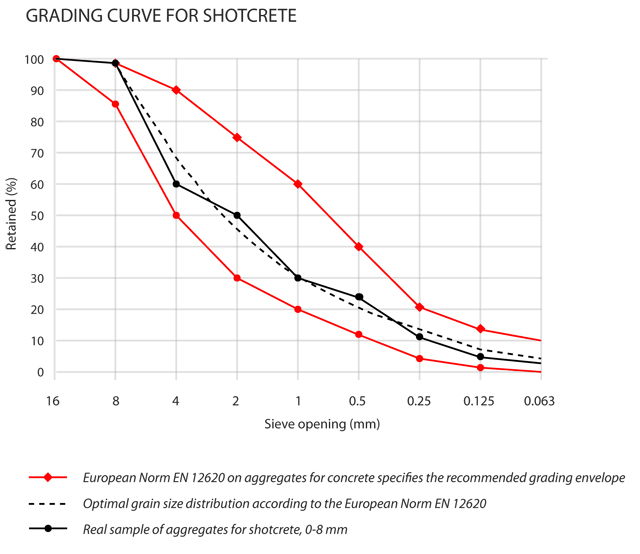
Passing and retaining grading curves
The difference consists in measuring the percentage of the aggregate which passes through the sieve, like in the latest examples (passing curves), or the percentage which is retained (retaining curve); in this case the curve is declining:
Pay special attention to the fines content
The fines content of the mixture is important to achieve a good a compression of the shotcrete mixture and to improve its workability.
Besides the fines in the aggregate, the total fine material of the shotcrete mix includes binder content, consisting of:
- Cement
- Additives (fly ash, silica fume, etc)
The recommended fines content of the mixture lies between 450 and 500 kg/m3, thus if there is a lack of fines in the aggregate, it should be compensated with binder content.
The following graphic shows in the yellow part, the optimal properties contained in the mixture if the total fines content enters into the recommended rank, as well as the most common problems in the contrary case:
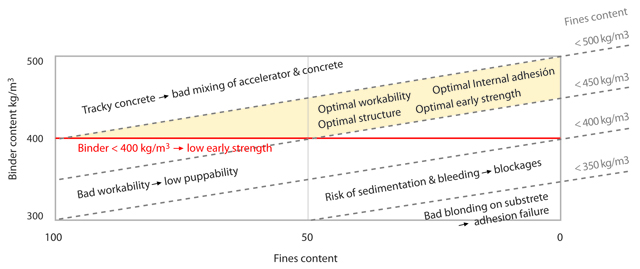
Fines content in the shotcrete mixture according to the norm EN 12620
To achieve the desired spraying quality, besides having the right particle size distribution in your shotcrete mix it is necessary to dominate the correct spraying techniques. Learn how to spray with our nozzlemen course.